Research from the
Center for the Study of Social Policy
suggests that the following
Community Conditions
nurture strong families:
- Equitable Access to Essential Needs
- Social Support and Connection
- Social Contract
- Racial and Social Justice
- Support for Building Individual Protective Factors
Communities that provide a connected cohort of these factors nurture strong families and protect our children. Every community has protective factors, and every family has unique strengths. When these factors work in concert, we create safe environments for children to grow up in.

What is families' access to economic opportunities, family-friendly employment, health care, housing, childcare, education, and food security? A family’s economic situation enables or prevents them from taking advantage of other protective factors. High-quality childcare is another essential need—research shows that parents and caregivers with more financial means tend to access higher quality childcare which provides many benefits for their child.
Social Support and Connection
Parenting is hard and strong communities willing to address the stigma of child abuse and neglect can prevent child abuse and neglect. Community institutions like schools, churches, community centers, and family resource centers are an essential basis for social support. If these institutions are effective and accessible to all, they contribute to forming critical parent and family social connections , which prevent child abuse and neglect.
Social Contract
Public or institutional support complements friends, family, and neighbors and broadens the capacity for a community to strengthen families and prevent abuse and neglect. Strong communities promote positive social norms about parenting and advance restorative justice practices. They also have well-functioning response systems so that when abuse and neglect does occur, intervention at schools or in physicians' offices can help prevent further harm from occurring.
Racial and Social Justice
Communities investigate, examine, acknowledge, and address systemic racism. Inequity manifests in many ways, including in rates of child abuse and neglect. Rates of substantiations are significantly higher among Black and Native American children than White and Asian children. Racial disproportionality in the child welfare system stems from institutional and structural racism. These systems historically impact parents of color through implicit bias in the child welfare system and society in general, economic inequality, and the disproportionate involvement of child welfare and law enforcement in the lives of families of color. Initiatives that promote racial equity are critical in their own right and promote the other Community Protective Factors listed here.
Support for Building Individual Protective Factors
In addition to community conditions that directly support children and families, parents and caregivers must have access to resources that will help them strengthen their individual protective factors. These include parental resilience, social connections, parenting and child development knowledge, concrete support in times of need, and children's social and emotional competence. Research shows that access to and participation in effective Parental Education programs helps prevent child abuse and neglect and supports growth in these individual protective factors.
The research on Community Protective Factors is emerging, and we've worked closely with the Center for the Study of Social Policy and 90by30 on this effort. Please see CSSP's whitepaper on Community Conditions for additional detail.
California’s Risk Factors
A variety of factors place children and their families at greater risk for abuse and neglect. These are some of those factors that are endemic to California communities:
Institutional racism and systemic oppression over generations have disproportionately impacted families of color. Therefore, it is essential to recognize the inequity of child abuse and neglect rates along racial and ethnic lines in California. Rates of substantiations are significantly higher among Black and Native American children than White and Asian children. Rates of substantiation among Latinx families are also somewhat higher than their population percentage.

Racial disproportionality in the child welfare system stems from institutional and structural racism. In addition, these systems historically impact parents of color through implicit bias in the child welfare system and society in general, economic inequality, and the disproportionate involvement of child welfare and law enforcement in the lives of families of color. Therefore, initiatives that promote racial equity are critical and promote the other Community Protective Factors listed here. While the field is only beginning to understand the interplay of these factors, research suggests that concentrated poverty among demographic groups explains much of the difference in substantiation rates, particularly substantiated rates of neglect.
The federal stimulus and unemployment funds decreased poverty for one year. Unlike income inequality from previous recessions, there has been an increase in wages stemming from the Covid-19 pandemic, but the end of pandemic-era policies have driven the poverty rate up.

Research has shown that the economic hardship triggered by the pandemic has disproportionately impacted people of color and those with lower-education levels.
Research suggests that access to resources is the leading factor to why income, or socioeconomic status, is the strongest predictor of abuse and neglect rates.
Additionally, children under 1 year old tend to experience child abuse and neglect at higher rates than any other age group. This may be because of their size (infants are more likely to be harmed by even minor physical stresses), the reaction some adults have to excessive crying, or a child's lack of responsiveness. Research shows that abuse and neglect that begins during infancy is likely to be chronic and developmentally consequential when there is no intervention.

Research shows that high levels of unemployment increase economic uncertainty and stress for families. Unemployment in California peaked in April 2020 as a result of the COVID-19 crisis and has fallen but is still higher than pre-pandemic levels.

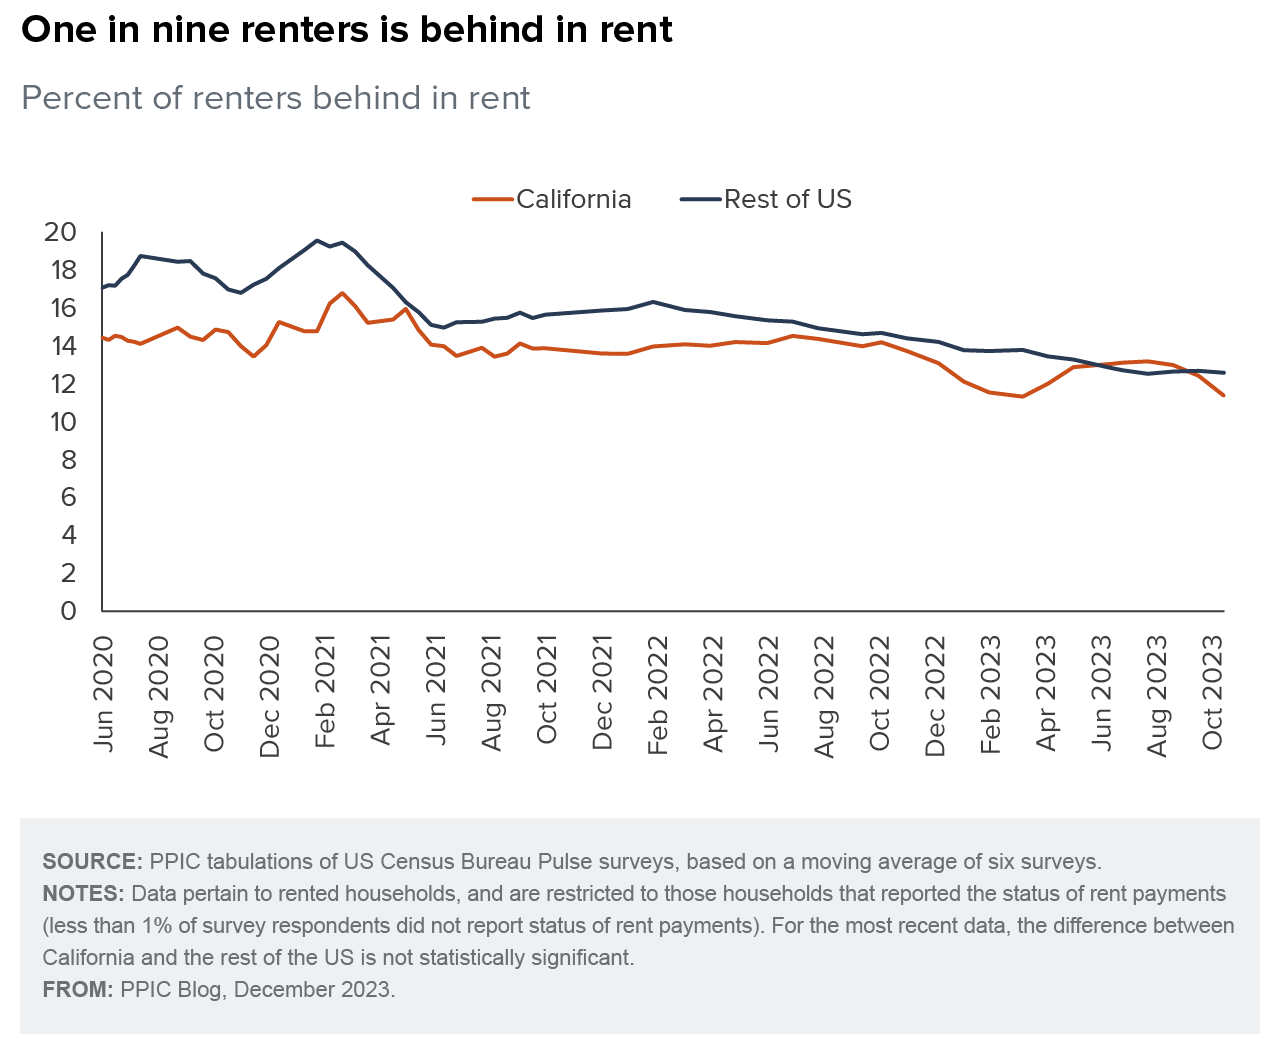
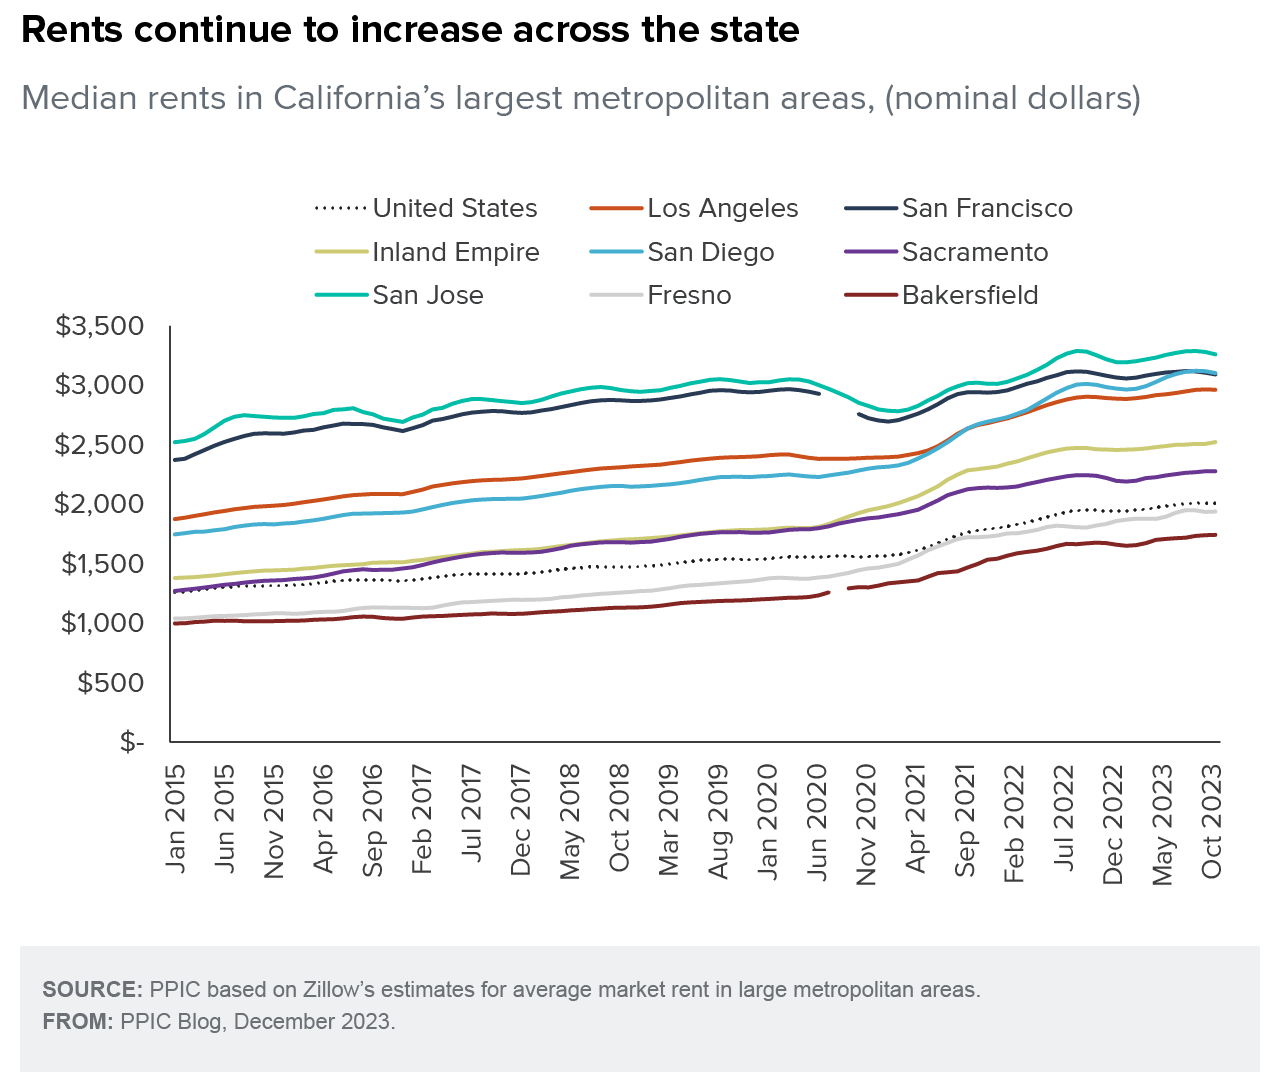
With housing costs in California doubled over the National average, Californians spend a disproportionate amount of their income on housing. California lost over 20,000 affordable rental units from 1997-2021—most of which were owned by for-profit entities. One forecast suggests the state will lose up to 7,000 additional affordable units in the coming year.
Homelessness is a major driver of temporary family separation, increasing family stress and the number of caregivers in a child's life. The US Department of Housing and Urban Development conducted a count of homeless families in 2021, and found that more than 18,500 family members were homeless in shelters around the state. Among U.S. States, California has the second highest number of people in families experiencing homelessness, second only to New York State.

Compared to other states where family homelessness is a challenge, homeless families in California are more likely to be unsheltered - that is, on the street, in cars or abandoned buildings, or in other places not suitable for human habitation. In 2020, six out of the top ten cities with the highest percentages of homelessness were in California.

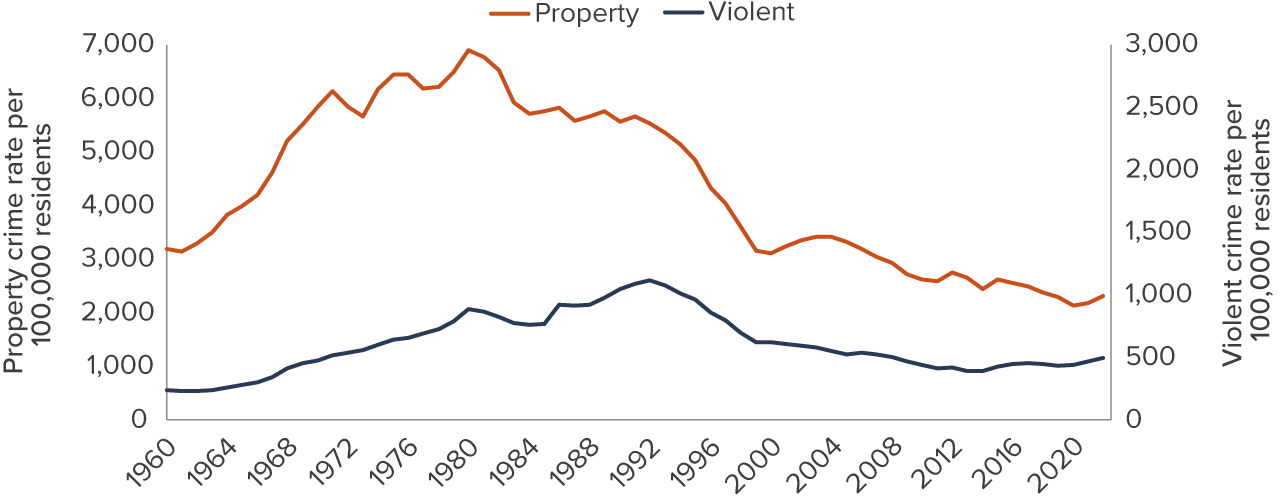
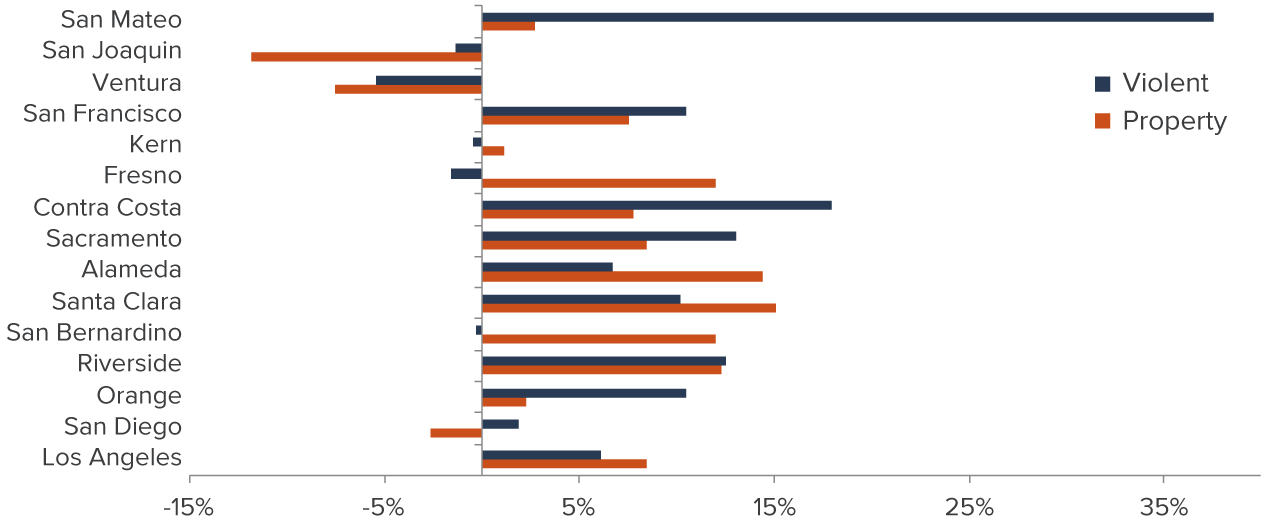
Across the state, families exposed to a culture of violence often experience trauma, strain, and fear, all of which increase the likelihood of child abuse and neglect. While 2021 data is not yet available statewide, Preliminary data from Oakland, San Francisco, Los Angeles, and San Diego suggest that property and violent crime are trending up.
 Metro-Area Violent Crime
Communities witnessing more violent crimes are associated with higher risk for child abuse and neglect and poor outcomes.
Families with problematic alcohol or drug use often experience trauma, strain, and fear. COVID-19 has had mixed impacts on drug and alcohol use. Research shows that problem drinking increased in the first several months of the pandemic, while drug usage changed with an increase in use of cannabis and anxiety medication offset by a decline in use of drugs often consumed in social settings like cocaine and MDMA. Preliminary California data show that opioid-related hospitalizations increased at an even faster rate after the start of the pandemic (see below).

Research on California Communities shows that increases in community level prescription opioid overdoses are associated with increases in child abuse and neglect and child injuries. Communities with higher rates of non-medical prescription opioid use may experience greater levels of child harms.
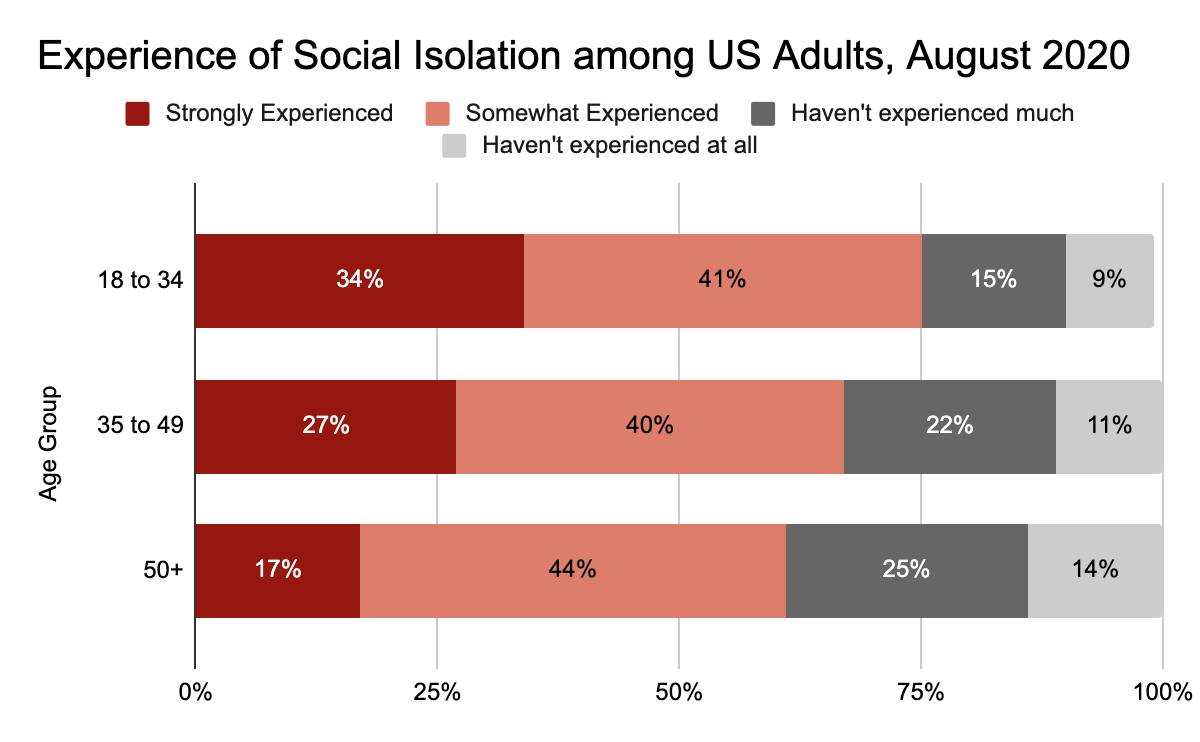
Social isolation and loneliness are important risk factors for child abuse , and conversely strong peer networks and social connections protect against abuse. The COVID pandemic and subsequent social distancing measures have led to a population-wide increase in social isolation. One representative national survey found that over 70% of adults under 50 report having at least some sense of social isolation since the beginning of the pandemic.